Lost Decades
The concept of a "lost decade" was first coined in the 1990s to describe Japan's economic downturn after a burst in their stock market and real estate bubbles. However, this term has now become a common way to describe sluggish periods in other countries and during different time periods that leave investors with meager returns and a sense of disappointment.
In today’s post, we argue that the United States is on the cusp of a lost decade, thereby underscoring the necessity for investors to explore alternative investment vehicles beyond the stock market to preserve and grow their financial assets.
What Are the Traits of a Lost Decade?
-
Low real GDP growth
-
High unemployment
-
Low consumer confidence
-
Lower, or very volatile stock prices
Lost Decades in the US Economy

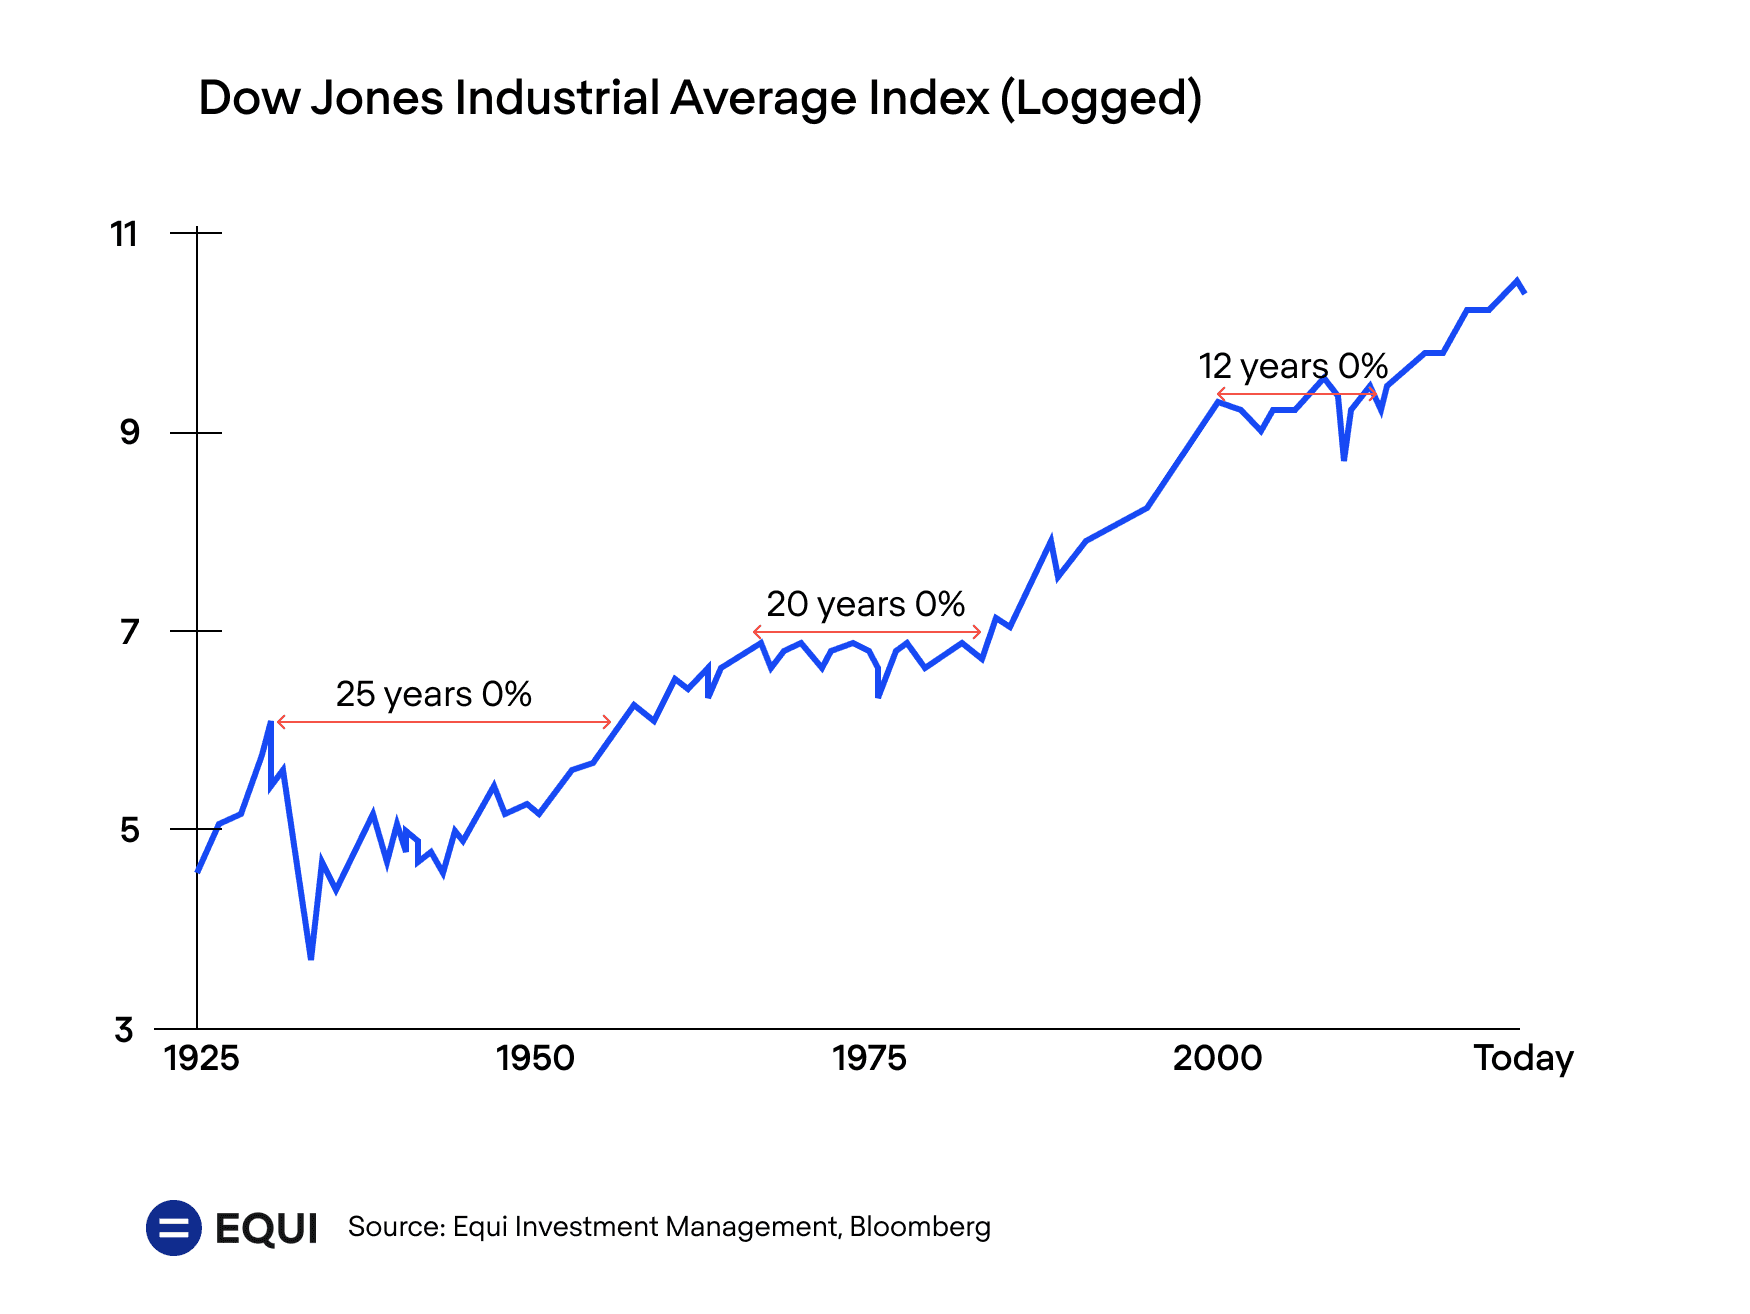
Most economists might argue that the United States has only experienced one real lost decade following the stock market crash in 1929. During the Great Depression, the US faced high unemployment, widespread poverty, and a significant decline in economic activity.

We contend that there have been multiple lost decades characterized by slow markets, with investors waiting over a decade to receive a meager return on their investments. For instance, investing $100,000 in the DJIA in 1965 would have yielded only a 1x return by 1981 after a prolonged period of waiting for a bull run that failed to materialize for 16 years.
Similarly, an investment of $100,000 in 2000 would have yielded a nominal return of 0% by 2013.

Signs that We’re About to Enter a Lost Decade
If you’re clinging to your stocks with the expectation of a forthcoming bull run, it's imperative to note that you could be waiting a decade or more. Recent signals suggest that we are emerging from a bull run, with numerous economic indicators pointing to the United States teetering towards another dismal decade of stagnancy.
Data Point #1 - Real GDP growth is low
US GDP growth has been at an average of 2.0% annually over the past decade, but the IMF predicts a decrease to 1.3% in 2023 with a high chance of it being under 1%.
Data Point #2 - We are less efficient
Total factor productivity (TFP), the gauge of an economy's efficient use of labor and capital to produce goods and services, suffered a significant 1.2% decline in 2022. Notably, for the first time since 1993, both capital and labor growth have surpassed output growth.
Data Point #3 - We are getting old
The US population is aging, which could have implications for TFP growth if older workers are less productive than younger ones. This could be due to factors such as declining health, reduced learning capacity, or a lack of familiarity with new technologies.
Data Point #4 - We’re not building as much work equipment
The rate of increase in physical assets used for production, known as the capital stock growth rate, has slowed down in recent years. The average annual growth rate of non-residential fixed investments, which include structures, equipment, and intellectual property, decreased from 5.1% between 1947 and 2007 to only 2.1% between 2007 and 2017.
So What?
Whether you’re exploring Equi products, or exploring alternative assets generally, we recommend diversifying your portfolio into vehicles that are uncorrelated with one another and uncorrelated with economic growth. For example, investors might consider investing in emerging economies that are projected to have strong real GDP growth over the next few years. For example, although the IMF was not as bullish on U.S. GDP growth, it has projected an average annual real GDP growth rate of 6.9% between 2022 and 2026. Another option is to invest in defensive sectors of the stock market, such as utilities, consumer staples, and healthcare, which may be less affected by economic downturns.
